Track, Analyze and Visualize HR & Training Data for Free with Power BI
May 24, 2019
Posted by: CPHR Manitoba
Written by Dan Belhassen, President, Neovation Learning Solutions
HR teams are eager to collect and use training analytics data, but effective dashboards are missing from many HRIS & learning platforms. That’s because training analytics dashboards are challenging to implement—and every end-user wants something just a bit different.
All disciplines, from marketing to sales to logistics, are itching for better ways to visualize their metrics and KPIs. This has sparked creation of a class of business intelligence, or BI software. These tools empower users to load in their own data and create their own dashboards and visualizations.
Some analytics tools require a graduate-level understanding of statistics to learn and use, but not Power BI. This free BI tool from Microsoft allows you to quickly import data files and create interactive dashboards and reports. Data visualizations can tell compelling stories that teach learners, demonstrate the impact of training to managers, or convince executives that eLearning correlates to improvements in KPIs.
At Neovation, we use Power BI as part of the analytics suite with our Agile Microlearning platform. This allows our enterprise clients to build and distribute their own custom dashboards. Any HR team can use Power BI in a similar manner with their own training or HR datasets.
Let’s explore the steps in building a custom interactive dashboard. We’ll use a fictional microlearning dataset.
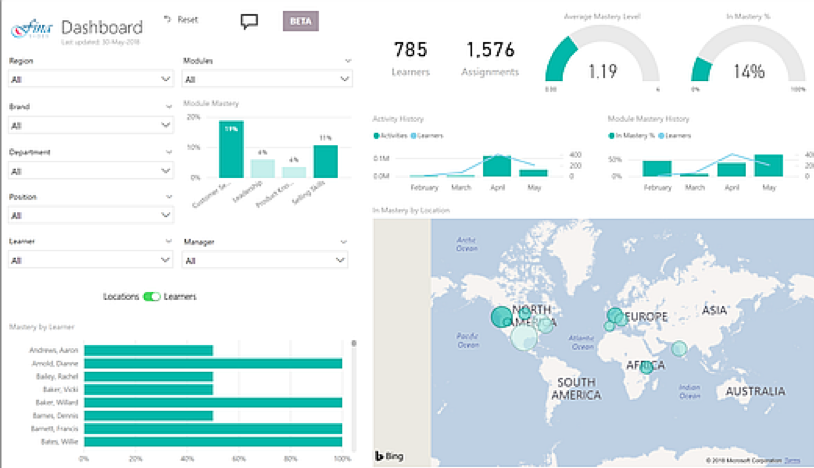
Figure 1: A sample analytics dashboard powered by Power BI, showing an overview of learner mastery
How to use Power BI
The first step to using Power BI is to load in your data files. You may have a single datafile, or multiple data files to are to be joined together. The easiest datafile format is Microsoft Excel.
Once your data files are uploaded, you must establish relationships between the different tables. For instance, if you have a table of your users and a table with their scores (in our example, mastery levels by module), you simply link the common data columns so that Power BI knows how to connect your data.

Figure 2: An example of linking related data across tables
Once your data points are connected, you’re ready to design your dashboard. Power BI displays all of your data. Simply drag data onto the page, then select a type of visualization. Presto!

Figure 3: Power BI creates many types of data visualization from your data
For example, you can create a bar chart that shows how many employees have reached the “mastery” level of a particular skill—and display the percentages by region or location.
It’s easy to change a visualization to a different format, or emphasize different data. Just click on it and select a different visualization type. Let’s change from a bar chart to an interactive map showing learner mastery by location.
Power BI offers more features with its AI-powered natural language queries. Explore your data by typing in a question. Power BI dynamically finds and visualizes the answer. Simply drag that visualization onto a page.

Figures 6 and 7: NLP query support makes it easy to find the data you’re looking for
Additional Power BI features
In addition to the clear dashboard with your learning analytics and the ability to easily create data visualizations, Power BI offers many more features:
● Add filters that automatically carry over and apply to your other pages. For instance, you may want the user to be able to filter the analytics by department, brand, country, job function, etc.
● Share dashboards with others in your organization; set row level data permissions to limit who can access what data
● Set an automatic refresh interval for your data (using the free Personal Gateway)
● Download your analytics as a ready-to-present PowerPoint
Using a tool such as Power BI to obtain and analyze free HR and training analytics enables you to break free of the pre-packaged reporting from your platforms, and start designing your own visualizations. You can give each learner access to the information they need to turn training data into actionable insights.
Power BI resources
Power BI offers guidance, sample data, and other resources to help you become a power user:
● Download Power BI for free
● Sample dashboards & reports
● Importing your data
● Creating and managing relationships
● Visualization options
● Using AI-powered Q&A to create visualizations
Dan Belhassen is the founder of Neovation Learning Solutions, a full-service eLearning innovator. Neovation recently launched OttoLearn, an agile microlearning application that delivers analytics-driven drip training for learner mastery and retention.
dcb@neovation.com, 855-885-2469 x201
|